POWER AUTOMATE DESKTOP - DATABASE Pre-Requisites Power Automate Desktop Access to database Under the database action, we have only three sub actions, namely: Open SQL connection Execute SQL statement Close SQL connection Open SQL Connection The first step is to connect to the database. So, we will use the Open SQL connection action and provide a connection string to establish the connection (the connection string in the video is a sample). When the connection is successful, the connection details is stored in a variable during execution. Execute SQL statement This action can be used to execute SQL queries. Here, I am using select query and the result is stored in a variable of type datatable. Close SQL connection It is a best practice to always close the database connection once the required queries are executed. YAY! BONUS!😮 How to execute a stored procedure using database action? Stored Procedure without arguments Stored Procedure with arguments (Comma separated in...
POWER BI
Here's a brief idea on Power BI!
Power BI is one of the tools available in the Microsoft Power Platform.
Well, what is it used for? Data Visualization and Business Intelligence!
Power BI connects to different data sources, transforms and cleans the data, creates different charts/visuals, which can be converted into dashboards, analysis reports, interactive visualizations, etc.
Business Intelligence
In simple terms, BI is a process that uses software services to analyze and present data, that helps to make informed business decisions.
Parts of Power BI
- Cloud-version (Power BI Service)
- Desktop version(Power BI Desktop) ==> Which is totally free to download😉
- Mobile App(Power BI Mobile App).
Data Sources [PowerBI Connects to]
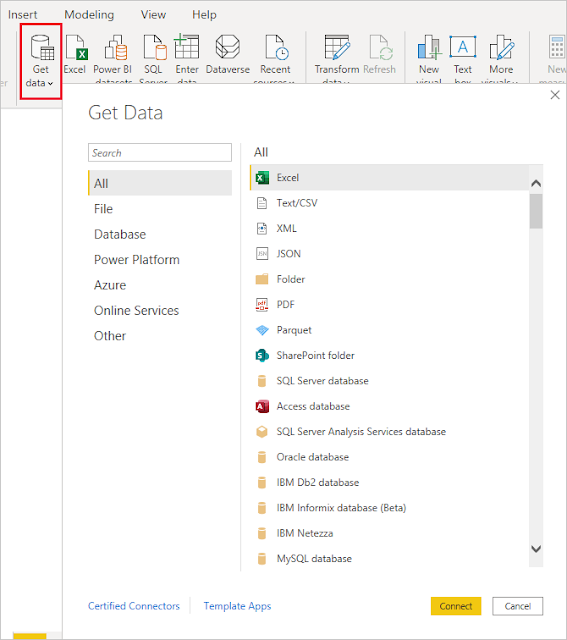
It can connect to Excel files, SQL Server Databases, Azure, JSON, XML, Oracle, Microsoft Dataverse, and so many other data sources. Take a look at the picture reference below:
Data Visualizations [Available in PowerBI]
Graphical representation of data.
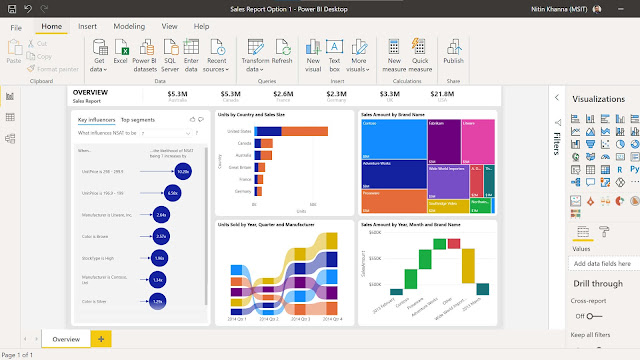
A dashboard/report can have any of these types of visualizations:
Bar and Column Charts, Donut Charts, Pie Charts, Decomposition Tree, Funnel Charts, Scatter, and many more.
Reports
As soon as you open either Power BI Service or Power BI Desktop, what you will be creating is a Report. A report has multiple-pages (also, can have single page) of a number of data visualizations that is related to certain data/data sets.
We could say that it is - a detailed understanding/view/multi-perspective view of any dataset or data stream.
Normally, a Report is created in Power BI Desktop and then Published to Power BI Service. The report can then be used in Power BI Service to create Dashboards that can be shared with consumers.
Dashboard
A dashboard is a set of data-visualizations of a certain data, put together in a single-page, to tell a story.
Since it is single-paged, you can think of it as highlights (like headlines of the whole report) of the whole data being represented. Dashboards can be built only on Power BI Service. Each visual in a dashboard is pinned from its report.
If you want to explore details from the information available in the dashboard, you can navigate to its report.
The Power BI mobile app users can view any report in the app, but the reports created for computer-screen-size can be difficult to view in the mobile screen. In Power BI service or desktop, a mobile-optimized view of a report can also be created, and this makes it easy for mobile users to view.
If you guys are driven to learn more about Power BI, go here 👉 More on Power BI
Do leave a comment if you have any questions!
Thank you for visiting my Blog!


Comments
Post a Comment